
Munich Soccer Game by a4gpa is licensed under CC BY-SA 2.0
As the impact of data analytics in sports, soccer in specific, continues to increase at an exponential rate, predictive models are constantly evolving to provide insights into team performance and outcomes. The focus of this study is to apply a well-grounded analysis of the data in hand using a method called the Pythagorean Expectation, borrowed from a fellow sport, baseball. The model aims to predict the result of the 2023/24 EFL Championship after verifying the reliability of the process using data from previous seasons.
Pythagorean Expectation Explained
Pythagorean Expectation is the formula that is used to estimate the number of games a team should win based on the number of runs they’ve scored and the number of runs they’ve conceded. The formula was developed by renowned baseball statistician Bill James, one of the pioneers of sports analytics.
Applying it to soccer will be relatively different since it’s a low-scoring game and has a lesser number of games per season, thus forming a comparatively smaller dataset. Below is the formula for Pythagorean Expectation modified for soccer:
A bit about the EFL Soccer Championship
The EFL Championship is England's second-tier soccer league, featuring 23 teams competing in a 46-match season spanning over a year. It is renowned for its tight races, competitiveness and dramatic finishes (“Here’s Hogg… DEENEYYY!”). The top two finishers of the league are directly promoted to the Premier League, England’s first-tier soccer league, while there’s a playoff for the third spot between the following four teams. The bottom three teams are relegated to League One, England’s third-tier soccer league.
Data Collection and Cleaning
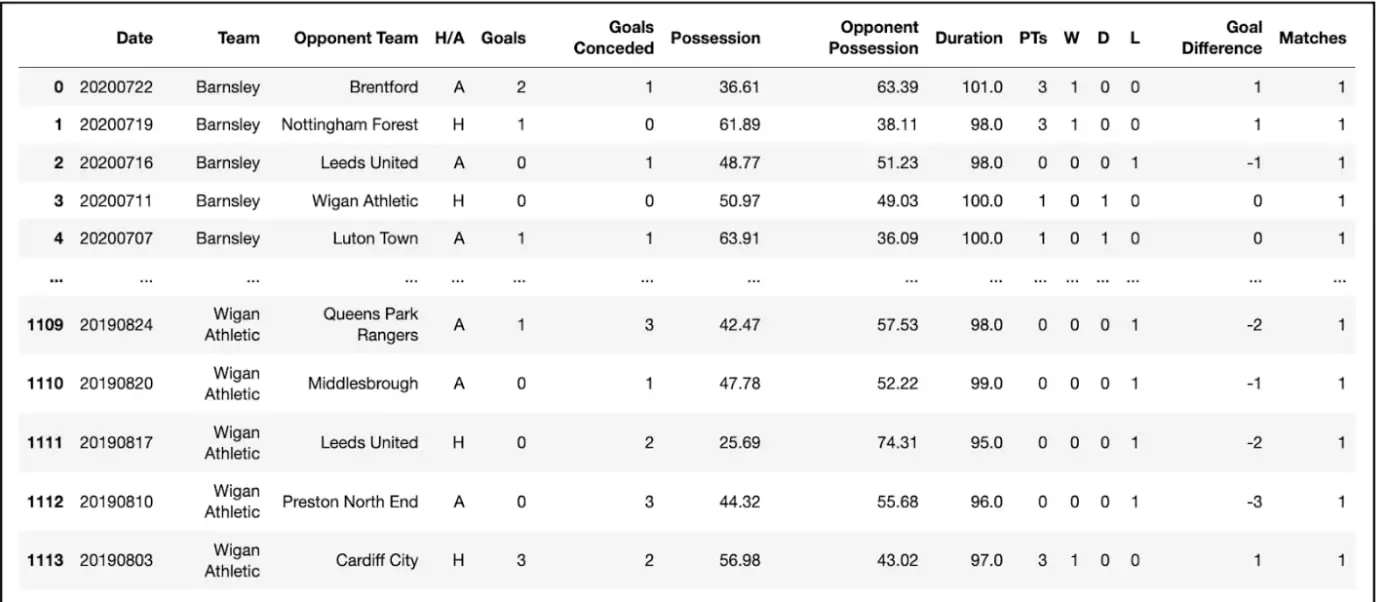
The dataset consisted of the matches played by each of the 23 teams from each of the past five EFL Championship seasons, that is, from 2019/20 to 2023/24. The last entry of the matches played in the 2023/24 season was on January 22, 2024 which makes it 28 games played per team. The cleaning process involved filtering out required attributes for analysis, modifying filtered attributes and adding necessary attributes.
Finally, before beginning the analysis process, the dataset was split based on the season the set of games belonged to, based on the game date. An example of the state of the data at this stage is shown below from season 2019/20:
Data Transformation and Analysis
This step involved transforming the match-by-match data for each season into a table format for better readability and interpretation. It also led to finding some unseen errors in the analysis process, which had to be accounted for before moving on to further data mungling. An example of the 2020/21 season’s match-by-match data transformed to a table-format is shown below:
Proof of reliability of Pythagorean Expectation from the past four seasons (2019/20 to 2022/23)
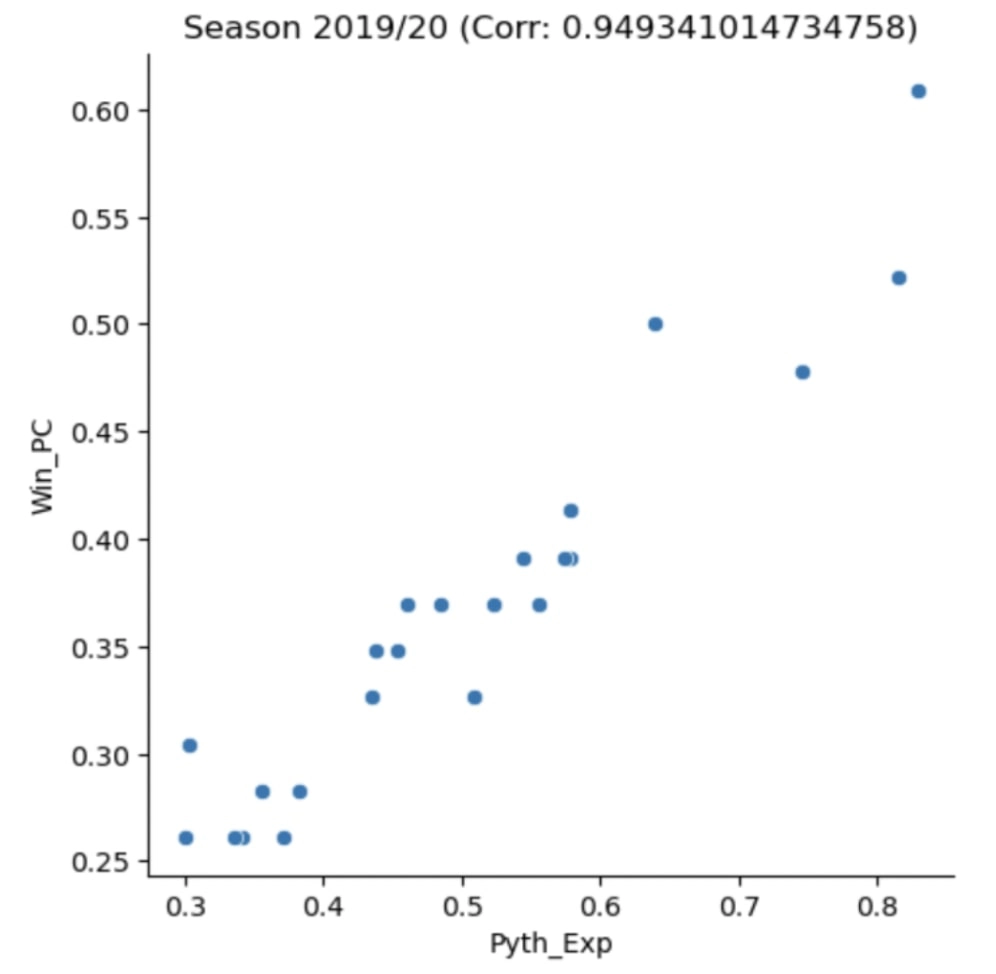
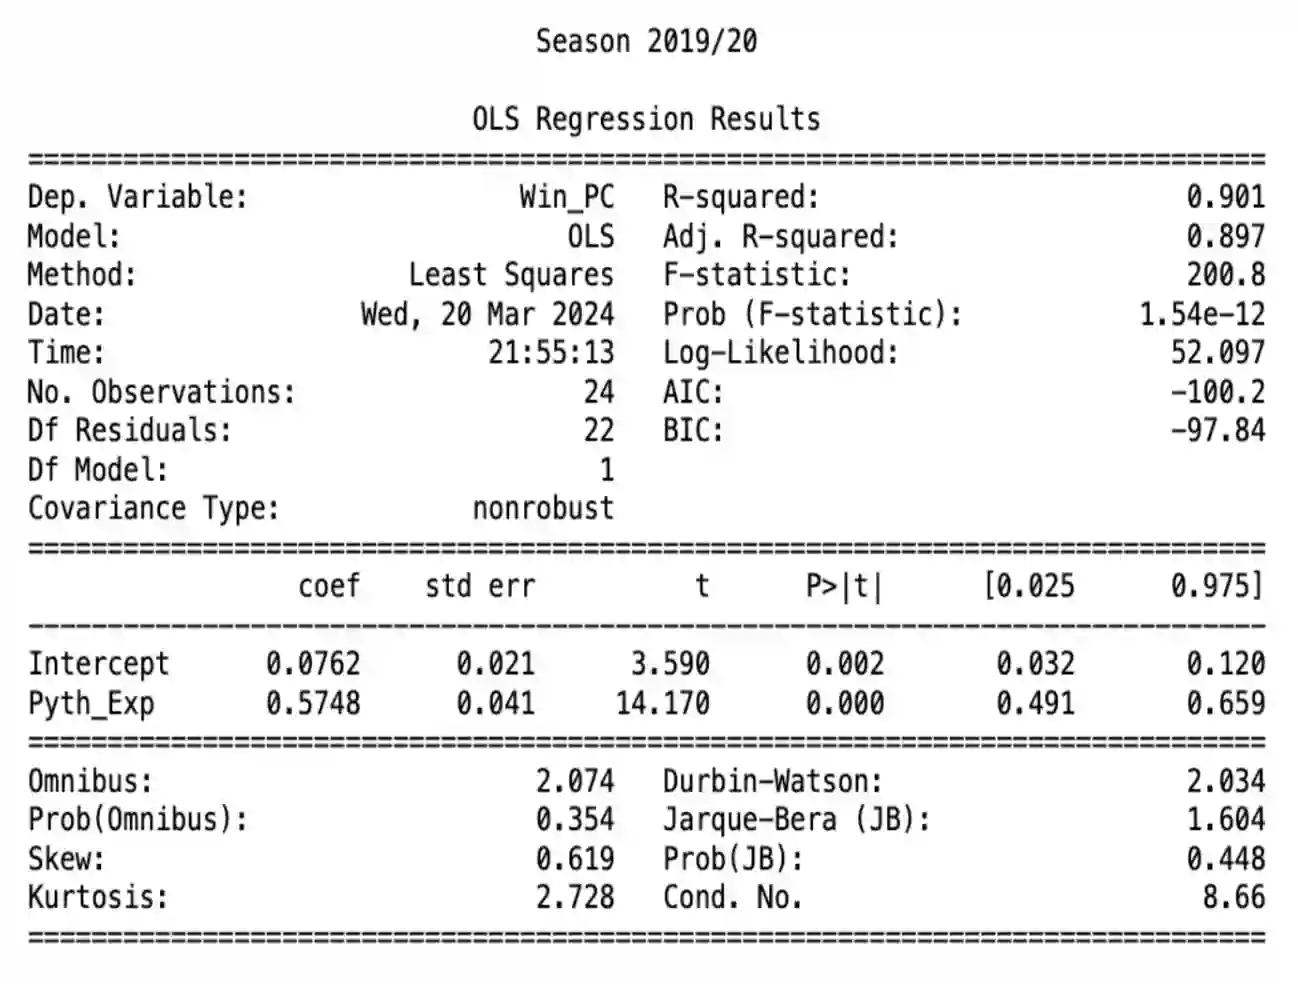
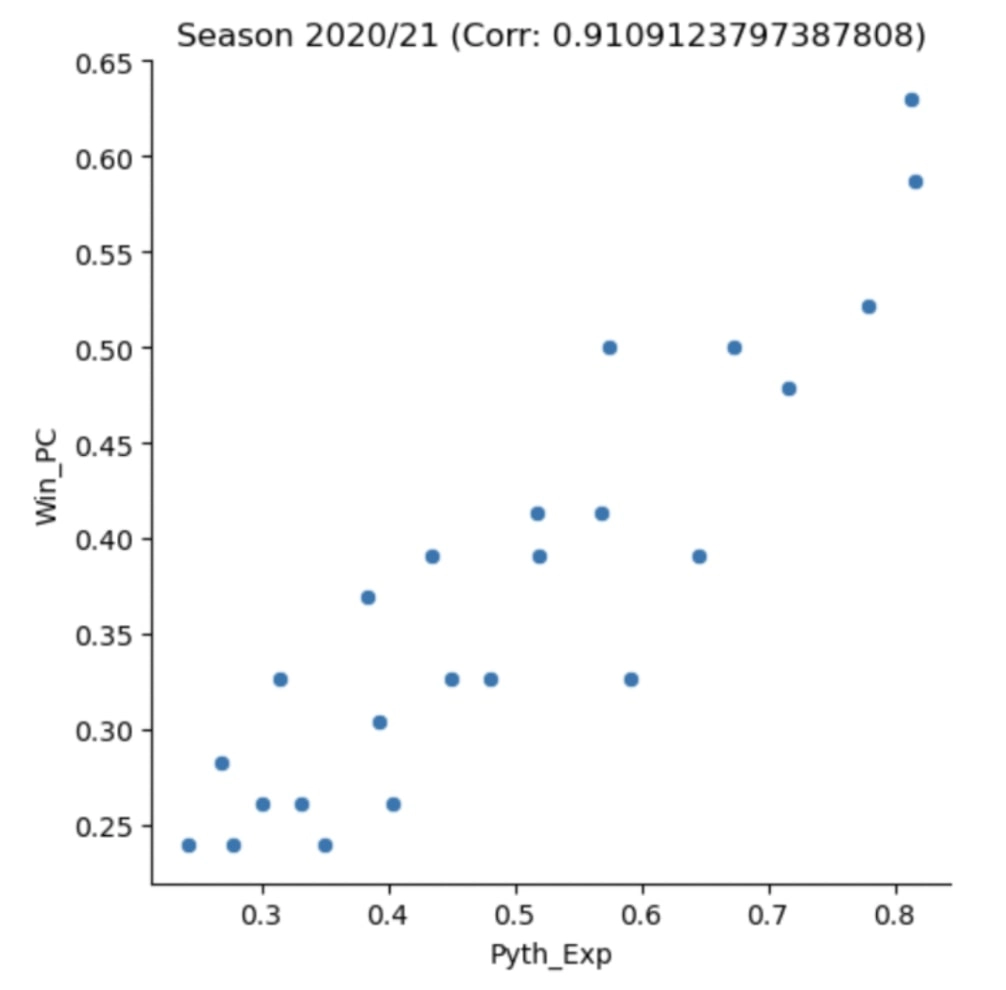
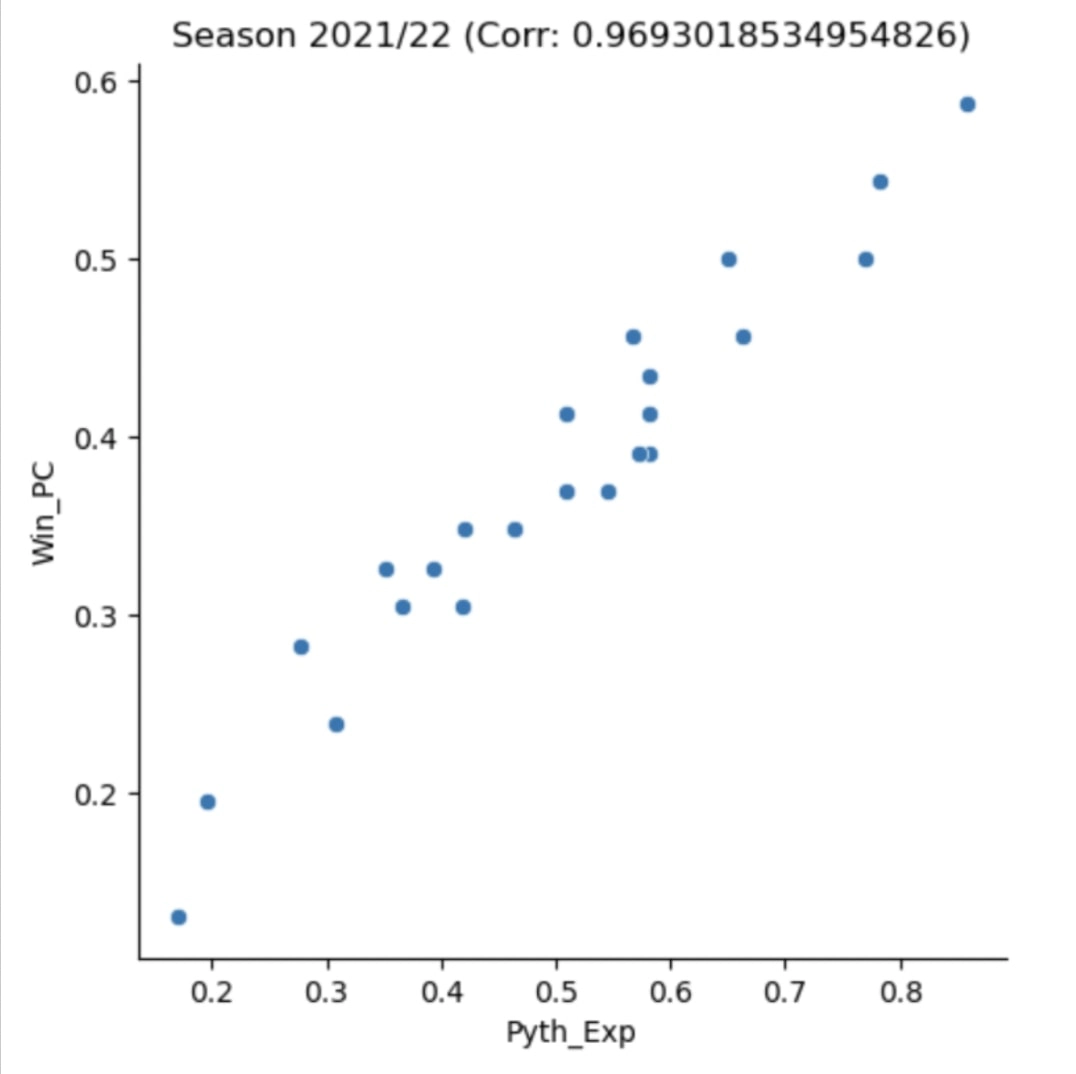
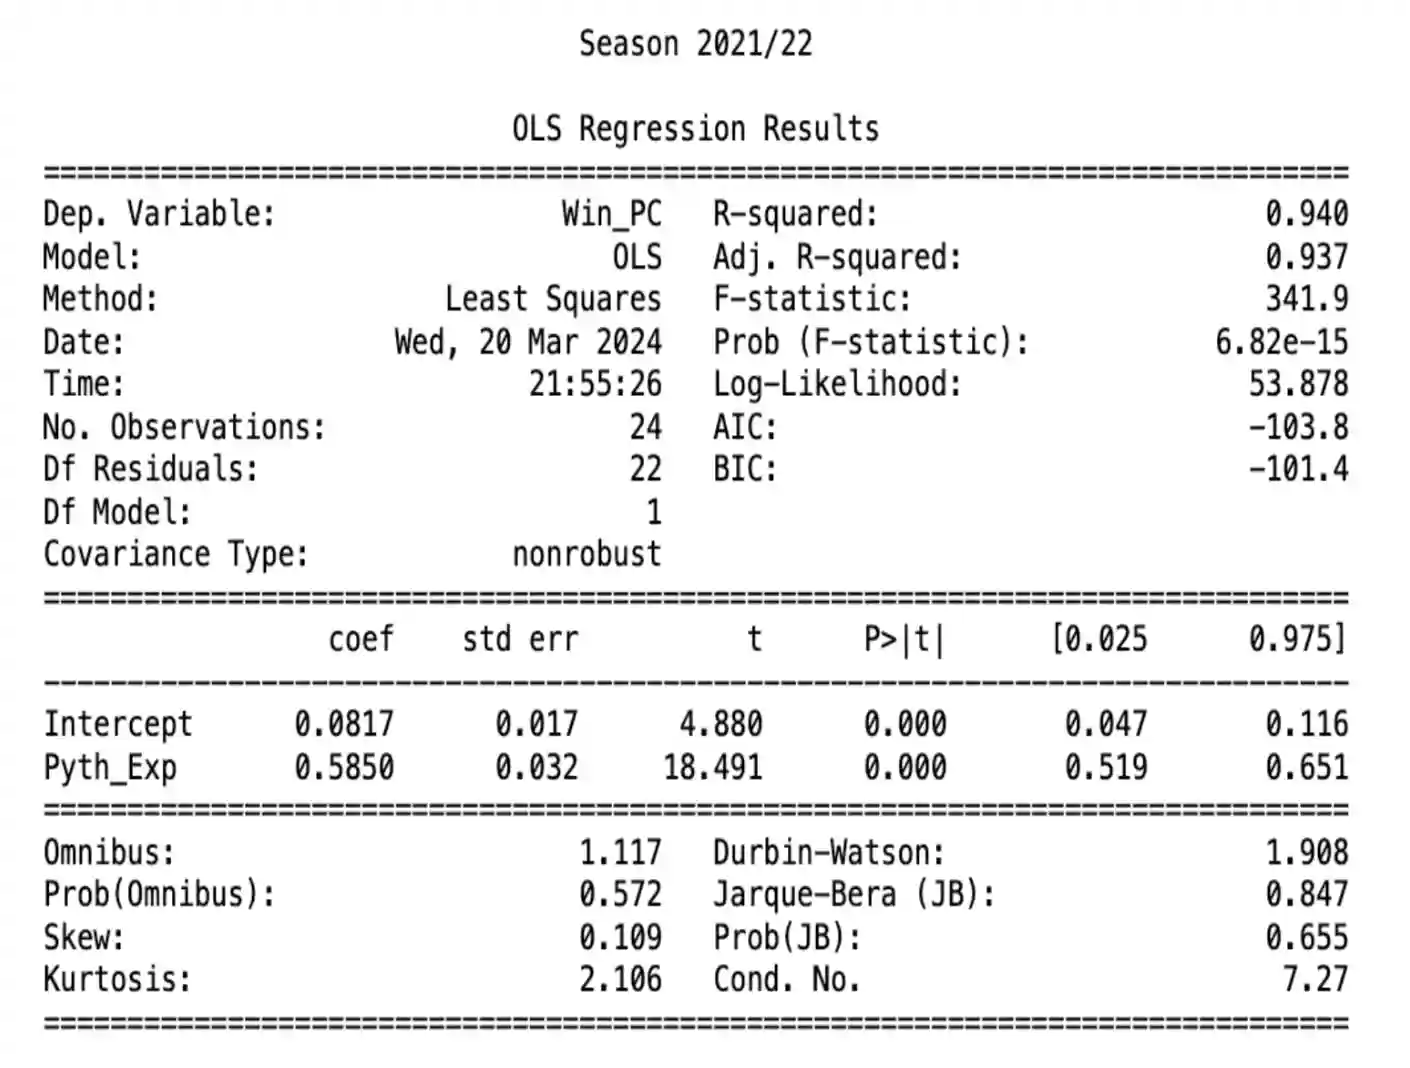
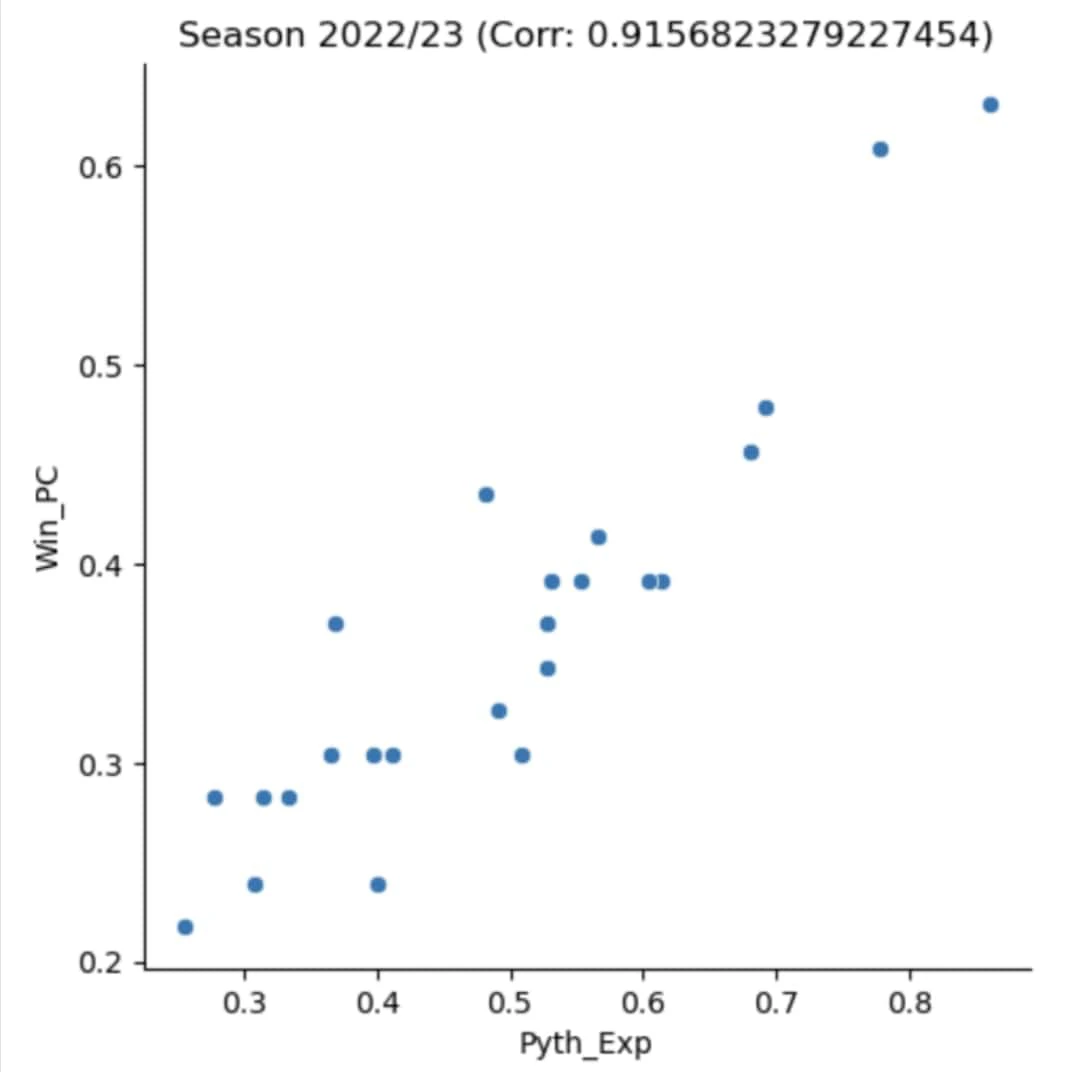
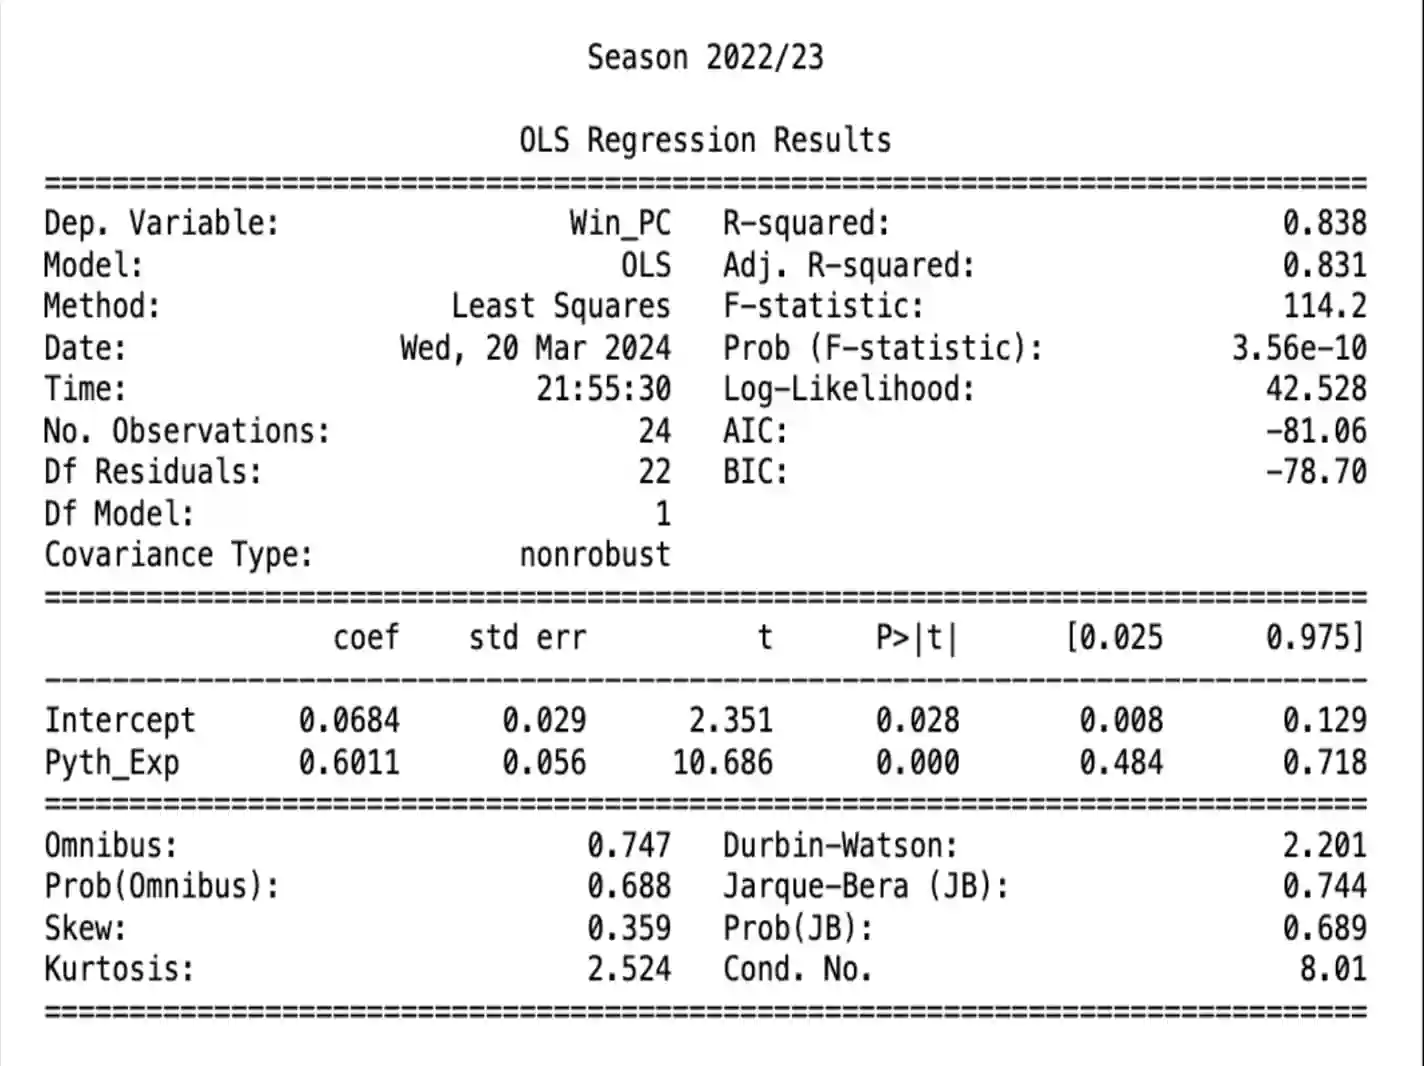
The reliability of Pythagorean Expectation as a predictor of the result of the 2023/24 season can be seen in the regression and correlation analysis results from the previous seasons. The graphs and regression results for those seasons are shown below:
On observation, it can be seen that in the graphs for all four seasons the correlation values between Pythagorean Expectation and Win % (0.949, 0.910, 0.969, 0.915), are above 0.9. Also on observation of the regression results, the coefficient of determination () values are all relatively high, thus signifying that Pythagorean Expectation explains Win % considered over the entire season quite well statistically.

How Pythagorean Expectation is a better predictor compared to Win Percentage?
This was shown by splitting the 2023/24 EFL dataset consisting of 28 games per team, to two datasets consisting of 14 games per team. Following that the predictability prowess of Pythagorean Expectation and Win % from the first dataset was tested against the actual Win % from the second dataset. The results are shown below and proves that the hypothesis was correct.
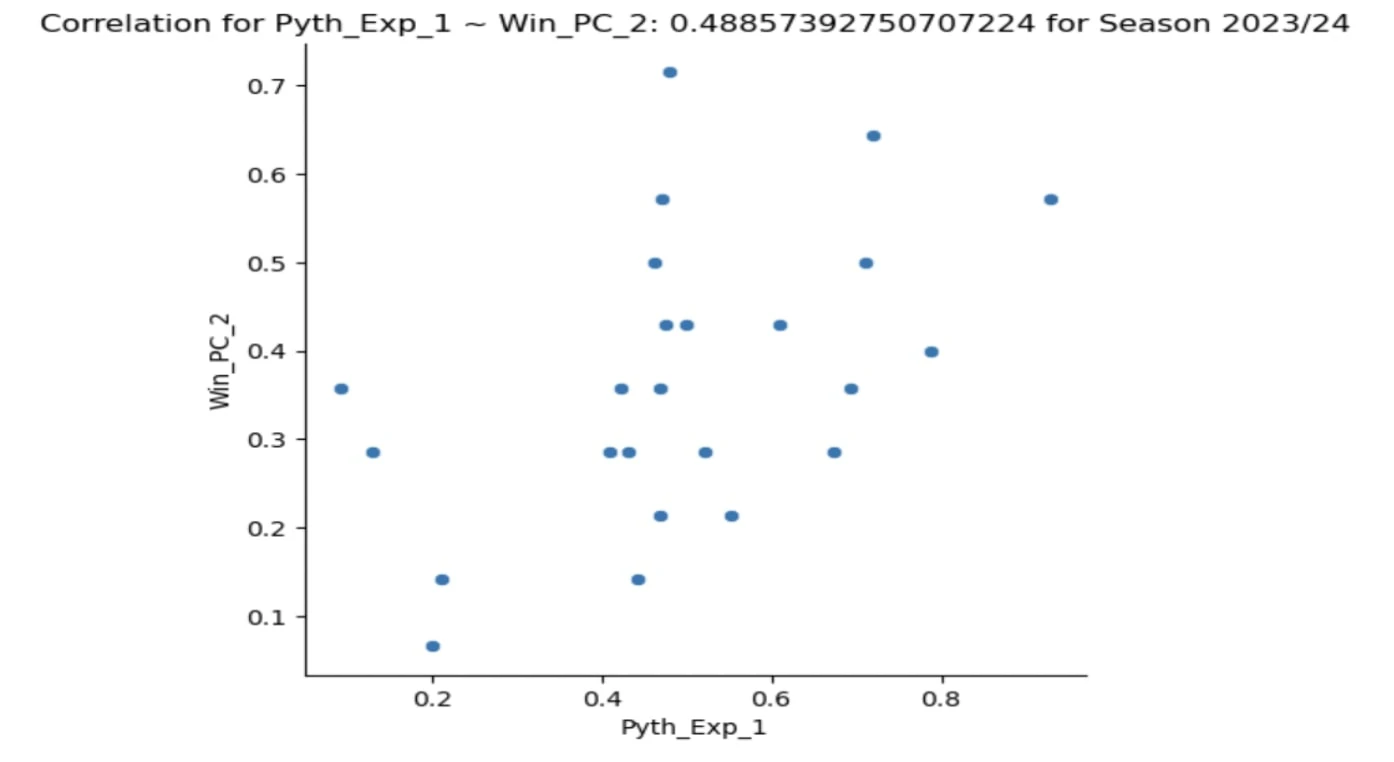
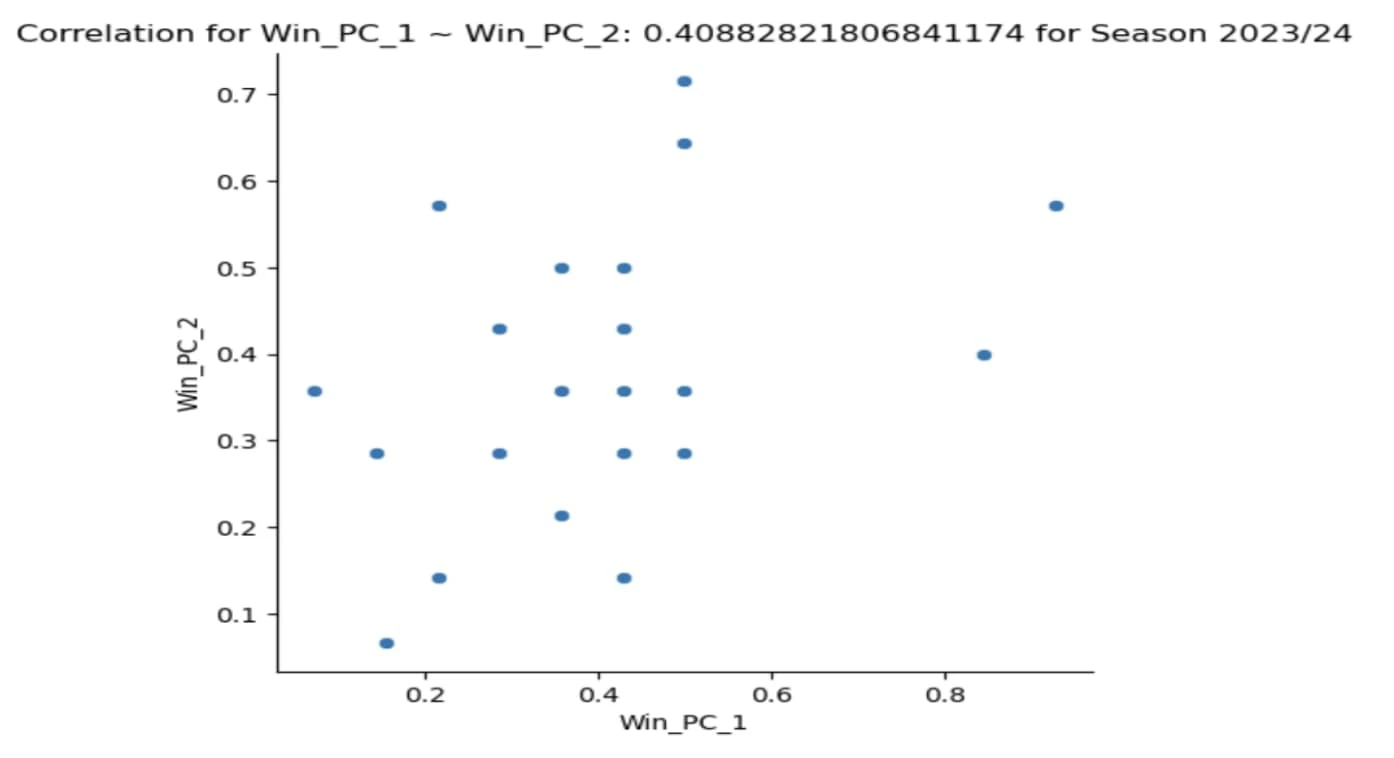
From the graphs, it can be inferred that Pythagorean Expectation is a better predictor than Win % since its correlation value is higher, 0.488 > 0.408. Therefore, this analysis and the analysis from the previous four seasons alludes to the fact that Pythagorean Expectation is a reliable predictor.
Predicting the result of the 2023/24 EFL Championship Season
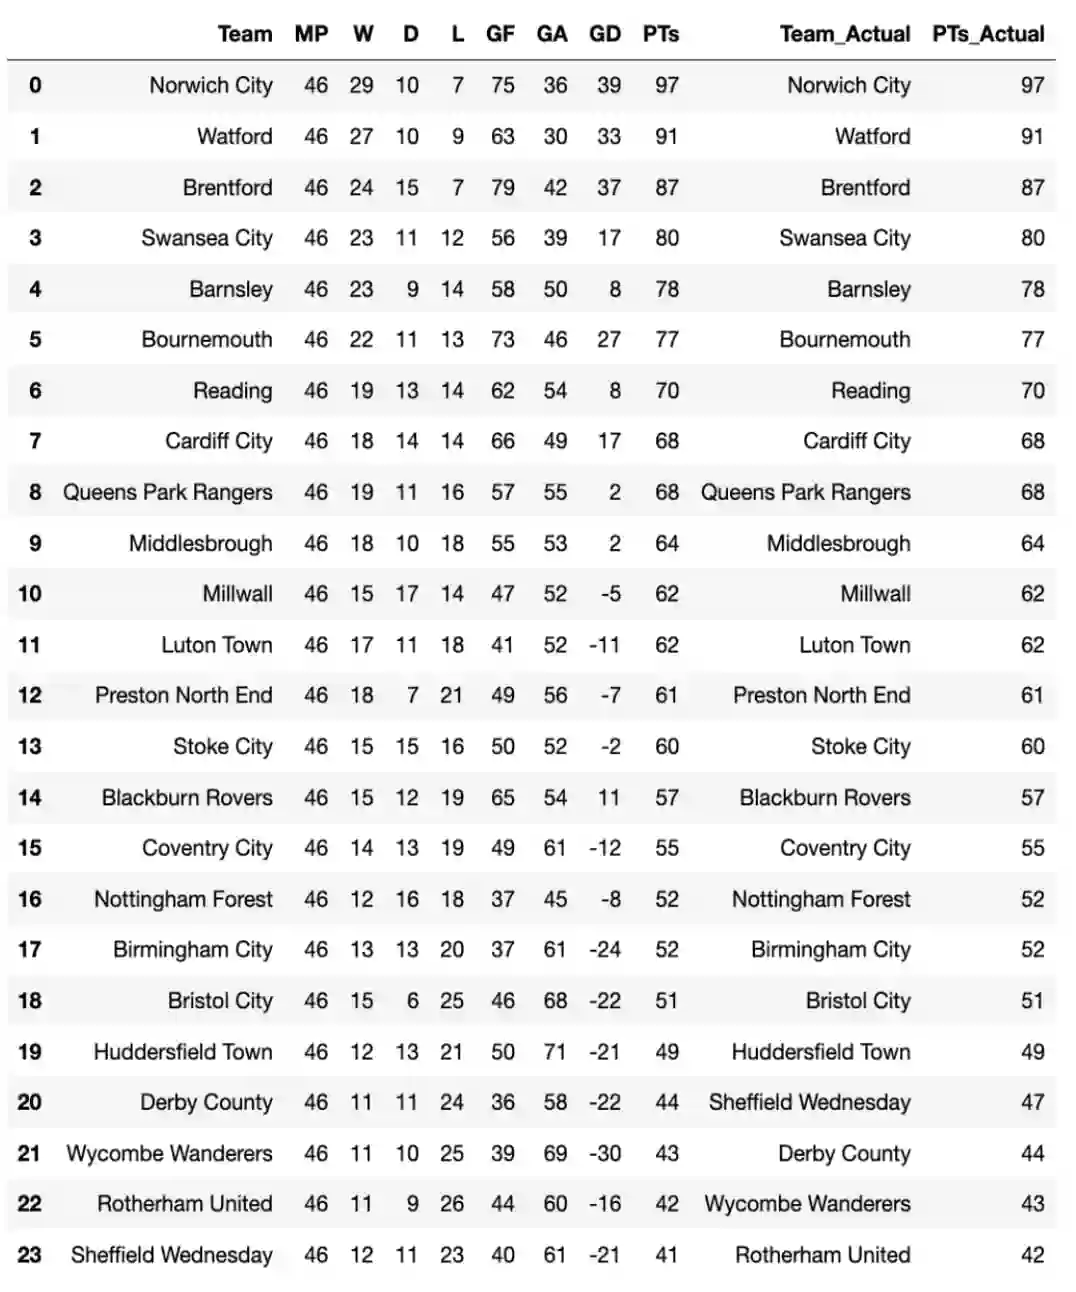
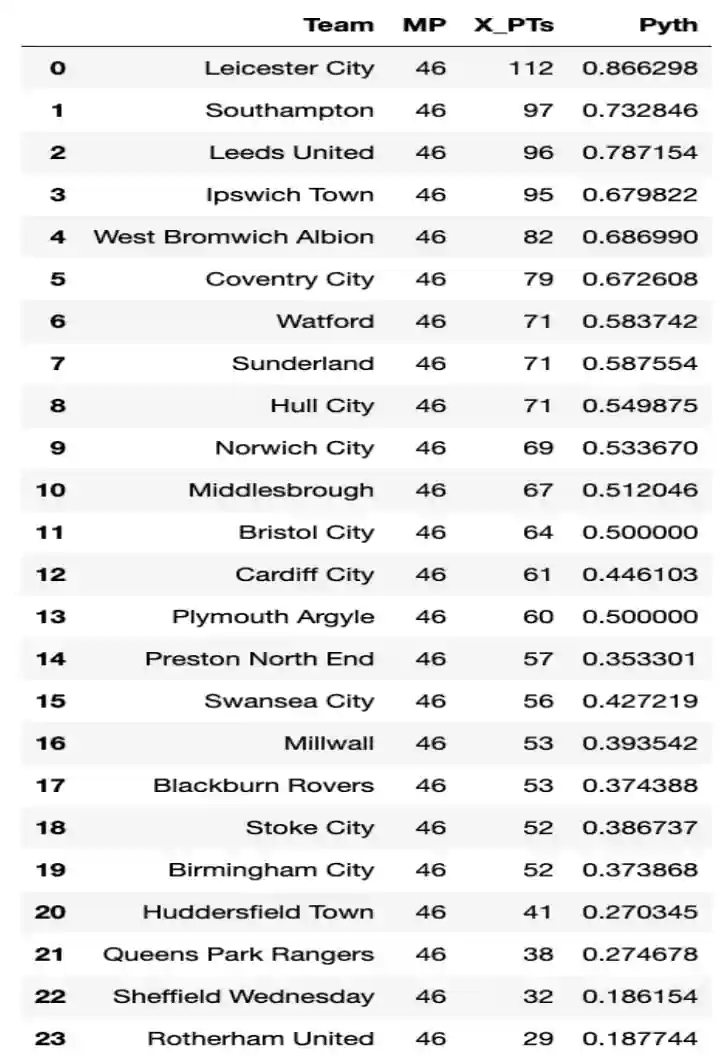
After assessing and showing the reliability of Pythagorean Expectation to be able to predict results in the previous seasons of the EFL Championship, the final step is to forecast the results of the rest of 2023/24 season and try to decipher any underlying anomalies. For this, a similar process was used and the following table’s attribute “X_PTs” signifies the number of points that each team can be expected to reach based on the Pythagorean Expectation calculated from the first 28 games played by each team
Result
Upon comparison with the end of season results, it can be observed that the model performed reasonably well in predicting the results. This can be shown by observing some statistical parameters between the predicted and actually observed table. The observed correlation coefficient between the predicted points and expected points is 0.9031 and the mean point difference is found to be 6.958. Here are the results:
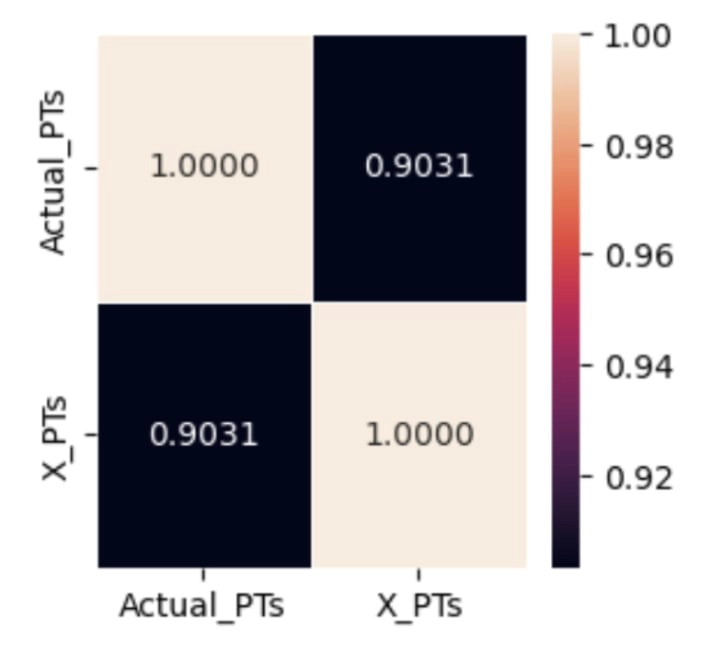
In terms of positional forecasting, the model was able to correctly predict the winner of the EFL Championship as Leicester City. The model also correctly predicted five of the six top finishers and one of the three relegated teams.
Overall, it can be inferred that the model was a success. As always, there is always an opportunity for further development and hence I invite you to explore the nuances of my findings for any improvement.
*Insert “Image 15”
Conclusion
While Pythagorean Expectation provides a solid foundation for predicting team success, its true value lies in its integration with broader analytical and game-specific, tactical frameworks to provide a comprehensive understanding and prediction of performance. Although Pythagorean Expectation is quite reliable within its parameters, it doesn’t take non-statistical unpredictable factors such as injuries, weather conditions to name a few, into account. Along with that, soccer being a low-scoring, small dataset game, some of these factors may play a significant role. By utilizing Pythagorean Expectation alongside other contextual and tactical insights, game professionals can make informed decisions on a game-by-game basis to improve team performances.
Sources
Note: AI softwares, ChatGPT and Gemini were used to assist in the drafting of this article, upon which statistical results and additional content from the author was added
Data for EFL Championship Seasons 2019/20, 2020/21, 2021/22, 2022/23, 2023/24 was provided by Samford University
Home of football statistics and history 11v11. (2024, March 16). League tables. Retrieved from https://www.11v11.com/league-tables/
Samford University. (2024, March 14). Sports Analytics - Fans. Retrieved from https://www.samford.edu/sports-analytics/fans/
StatsBomb. (2024, March 15). Improving soccer's version of the Bill James Pythagorean. Retrieved from https://statsbomb.com/articles/soccer/improving-soccers-version-of-the-bill-james-pythagorean/.
Author

This article was written by Sibi Karthik, an undergrad junior studying Computer Science. Sibi’s work involves Sports Analytics and Football Tactical Analysis. Having recently completed his Level 2 license in Coaching Football with the English FA, Sibi is working to continue to make a mark on the future of football.