
baseball glove by theseanster93 is licensed under CC BY-SA 2.0
Historical Significance
Throughout the history of baseball, the focus of the sport has changed and evolved. From the early Dead-ball era to the modern era of the long ball. Through it all one part of the game has remained largely unchanged: fielding.
Fielding is the backbone of any baseball team. As the saying goes ‘Defense wins championships.’ While in baseball this largely references the pitcher and not the defensive quality of the rest of the team, the position players for the team are important. The question is raised, how important are the fielders of a team?
Data
The data used in this blog post was gathered from Baseball Reference and Baseball Savant. Specifically, the teams’ records, ERA, and Fielding percentage was gathered from Baseball Reference, where Strikeouts, Hard Hit Rate, Outs Above Average, and Fielding Percentage Rates.
Charts
First, it needs to be determined if fielding has any impact on a team's win percentage. Each MLB team's fielding and win percentage from the past three seasons was collected and put into the following charts:
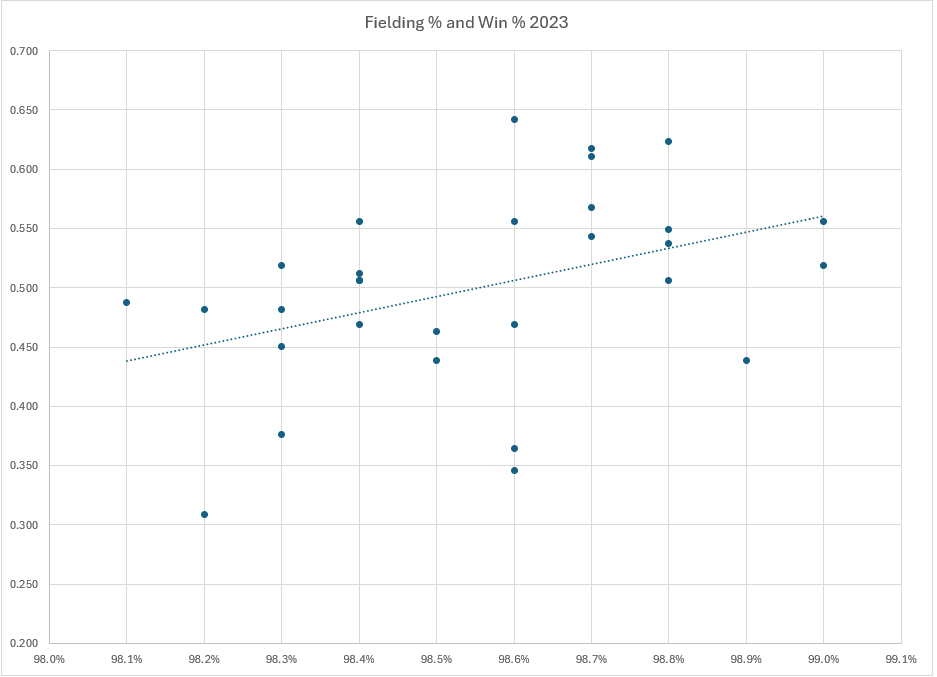
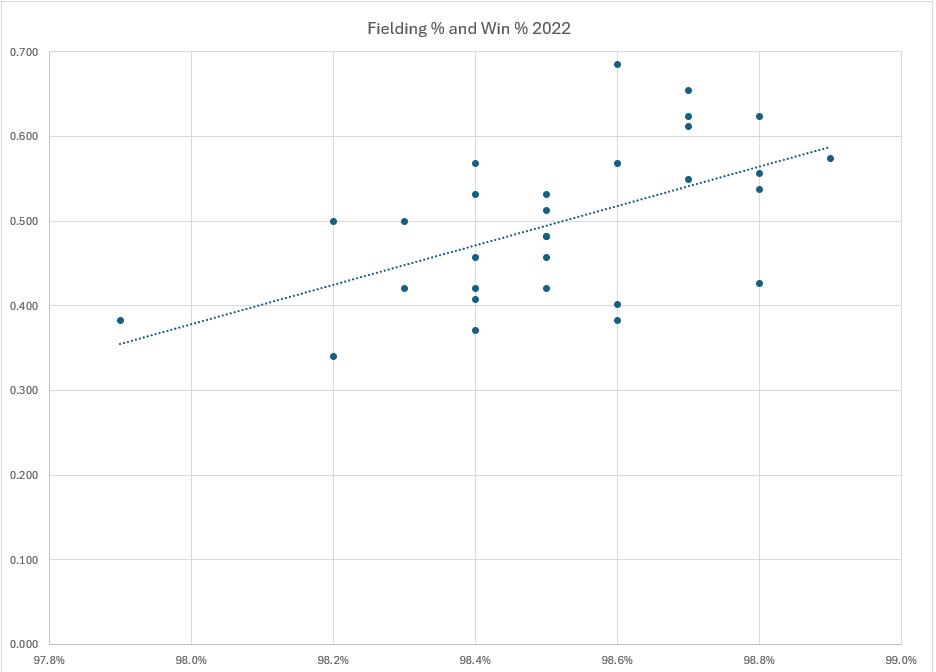
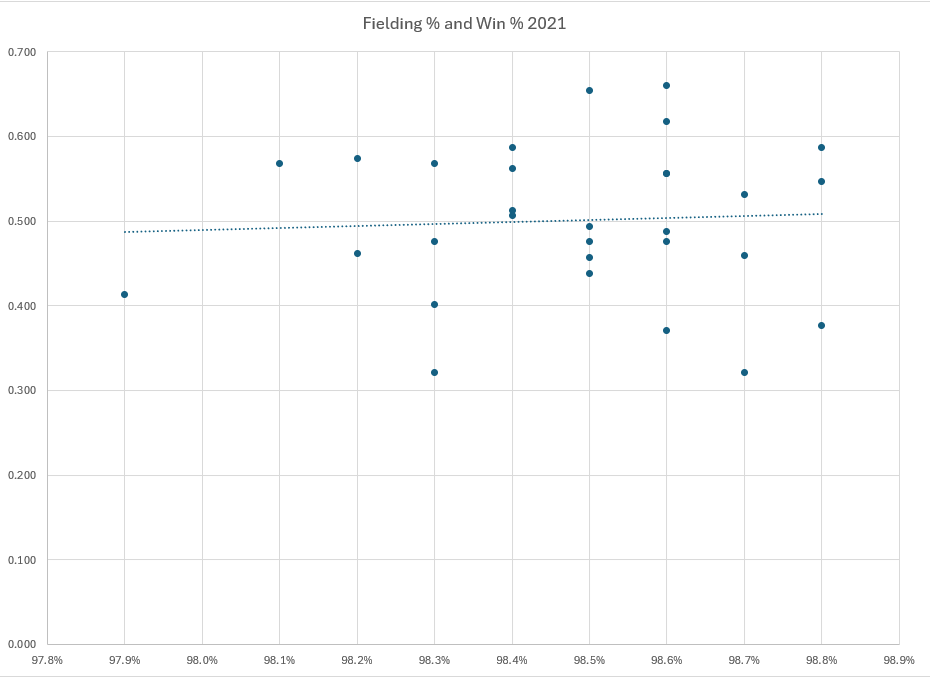
In 2023 there was a relationship between the teams’ win percentage and their fielding percentage. However, this relationship was slightly more significant during the 2022 season which is shown in the graphs above. During the 2022 season there was a relatively strong relationship between how often a team wins, and how well the team performs on the field. This relationship seemingly disappeared in the 2021 season, as it looks as though there is no impact from fielding percentage to a team’s winning percentage.
As this point came together there was one question that lingers. How does the fielding impact pitcher performance?
Fielding and Pitcher Performance
To effectively answer this question, there needed to be a measurable variable to measure pitcher performance and measure fielding impact. While normal fielding % could be used it was determined that Outs Above Average would be a better demonstration of the fielders. Outs Above Average is a metric considering the probability the player makes the play. Which means the more difficult the out is, the higher the value the fielder would receive should he make the play.
With one of the two variables determined a variable to illustrate a pitcher’s effectiveness was still needed. ERA, which looks at the earned runs a pitcher gives up was determined to be a possible answer to this need. This gave the following graph:
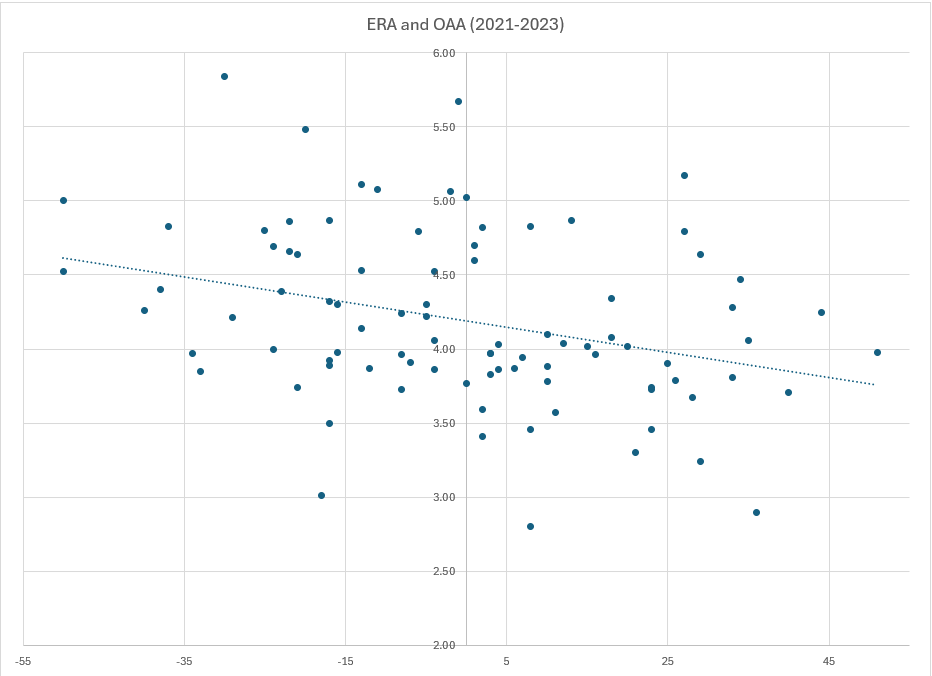
The graph shows that, while there is a trend it is not significant enough to warrant any correlation between the two. Which was the same findings as before. It shows that good fielding does not have significant positive effects while bad fielding has large negative effects. After taking time to look at this graph one final graph was made, one showing Outs above Average and Hard-Hit Rate against. Hard Hit rate measures how often a ball is hit over 95 MPH. Hard Hit Rate allows us to see how often the pitcher gives up a hit that has a high chance of resulting in a runner getting on base.
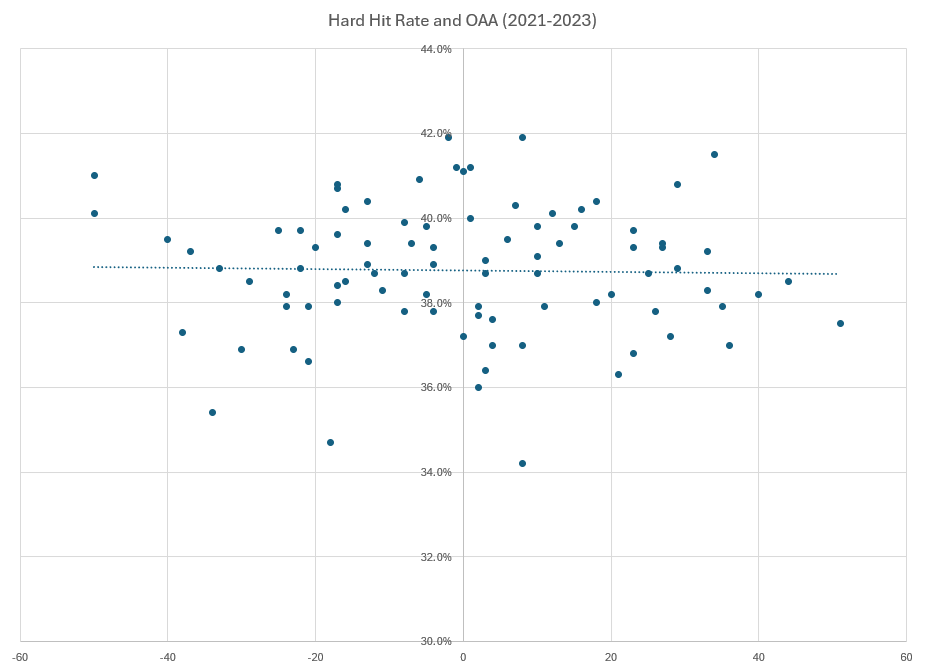
However, as the graph shows there is not a trend that can be attributed to these two points.
Conclusion
Ultimately there is seemingly very little to no significant impact from a team having a high fielding percentage. While a team is ‘punished’ by bad fielding performance a team is rarely ‘rewarded’ by having a good fielding performance throughout the season. In turn, fielding matters but it is not the most significant part of the sport. A team should still pay attention to their fielding skills but should rely more on their pitchers and hitters as the true difference makers for the game.
Sources
Baseball savant: Statcast, trending MLB players and visualizations. baseballsavant.com. (n.d.).
MLB stats, scores, History, & Records. Baseball. (n.d.-a).
About the Author

Matt Wyatt is a current Sophomore at Samford University. He is majoring in Marketing with a concentration in Sports Marketing and Sports Analytics.
Connect with Matt through the following:
Email: mwyatt3@samford.edu
