Within collegiate sports, few institutions capture as much respect and admiration as the Southeastern Conference (SEC). The SEC has always been recognized as an essential cornerstone of college athletics, recognized for its fierce rivalries and passionate coaches and athletes as well as fans. However, behind this competition is a complex financial landscape that has been shaped by various revenue and expense patterns over many years. This analysis will examine the financial performance trends of all SEC institutions (excluding Vanderbilt) in particular revenue and expense categories.
Revenues
SEC athletics generate revenues from various sources which includes ticket sales, donor contributions, corporate sponsorships, competition guarantees, and by government support. Throughout the period of 2018-2022, revenues experiences areas of growth as well as decline. However, despite these fluctuations, SEC athletic programs have continued to show resilience and adaptability in navigating the financial landscape.
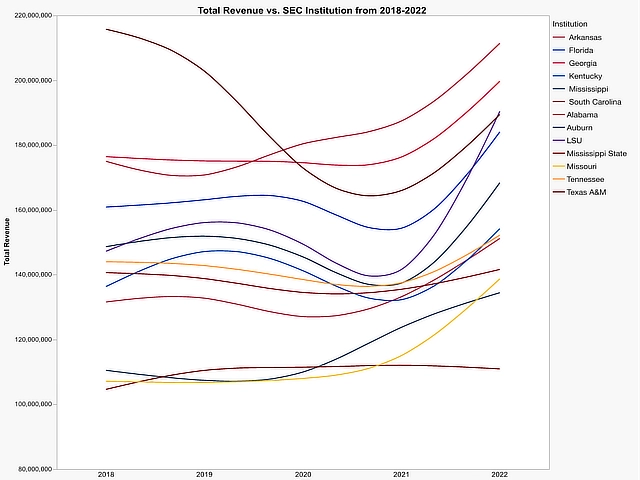
Top 3 institutions in 2018: Texas A&M, Georgia, Alabama
Bottom 3 institutions in 2018: Mississippi State, Missouri, Mississippi
Top 3 institutions in 2022: Alabama, Georgia, LSU
Bottom 3 institutions in 2022: Mississippi State, Mississippi, Missouri
Donor Contributions
Donor contributions have a large impact on revenues of SEC athletics. These contributions drive everything from facility upgrades to scholarships to paying operational expenses. During 2018-2022, SEC institutions witnessed varying levels of donor contributions which were probably impacted by fundraisings, alumni participation, and economic factors such as COVID-19.
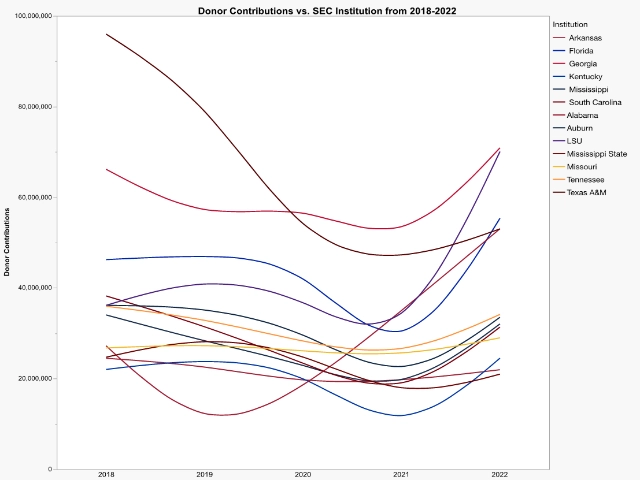
Top 3 institutions in 2018: Texas A&M, Georgia, Florida
Bottom 3 institutions in 2018: Kentucky, Arkansas, Mississippi State
Top 3 institutions in 2022: Georgia, LSU, Florida
Bottom 3 institutions in 2022: Mississippi State, Arkansas, Kentucky
Ticket Sales
Ticket sales represent another significant revenue stream for athletics which is primary driven by football and basketball games. Although each institution generates thousands of dollars’ worth of tickets, various factors influence these sales. These variables include stadium size, ticket prices, the number of games played at home, the inclusion of admission charges for other athletic events, weather conditions, and others. While there was a decline in ticket sales during COVID, no institution gained an advantage over other as they all faced the same situation.
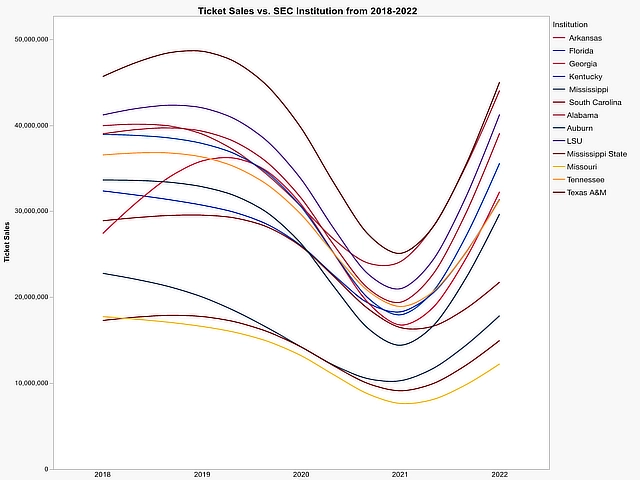
Top 3 institutions in 2018: Texas A&M, LSU, Arkansas
Bottom 3 institutions in 2018: Mississippi State, Missouri, Mississippi
Top 3 institutions in 2022: Texas A&M, Arkansas, LSU
Bottom 3 institutions in 2022: Missouri, Mississippi State, Mississippi
Expenses
While managing revenue streams is integral to the financial health of SEC athletics, managing expenses is just as important. Expenses can be as simple as buying sports equipment and upgrading facilities or can be more complex such as salaries and compensations. Controlling these expenses is vital for achieving financial success in athletics.
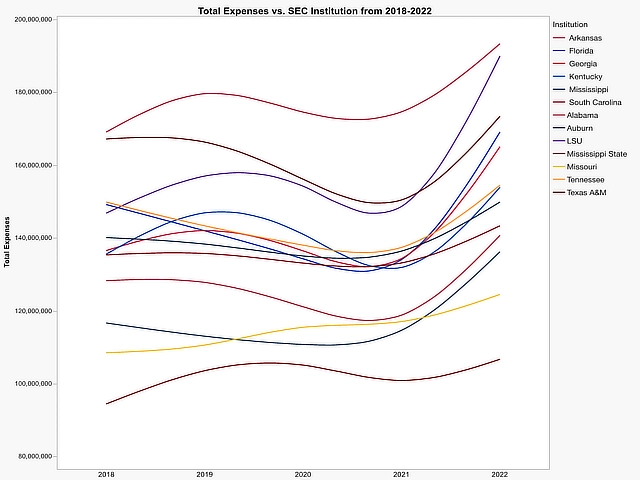
Top 3 institutions in 2018: Alabama, Texas A&M, Tennessee
Bottom 3 institutions in 2018: Mississippi State, Missouri, Mississippi
Top 3 institutions in 2022: Alabama, LSU, Texas A&M
Bottom 3 institutions in 2022: Mississippi State, Missouri, Mississippi
Total Football Spending
When discussing college athletics, football often comes to mind first for many people. Football is usually considered to be the financial driver of the SEC but that also comes with many expenses. During the span of 2018-2022, these trends have provided insights as to how much SEC institutions spend on football which includes the cost of athletics student aid.
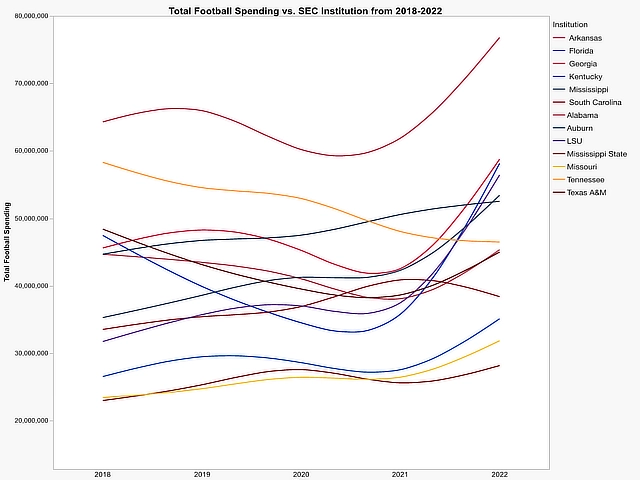
Top 3 institutions in 2018: Alabama, Tennessee, Texas A&M
Bottom 3 institutions in 2018: Mississippi State, Missouri, Kentucky
Top 3 institutions in 2022: Alabama, Georgia, Florida
Bottom 3 institutions in 2022: Mississippi State, Missouri, Kentucky
Recruiting
Recruiting represents an essential aspect of SEC athletics, with major investments made to draw the best athletes to play for that particular institution. During this period of time, recruitment expenses trend upwards even during COVID which shows the SEC proactive recruiting efforts.
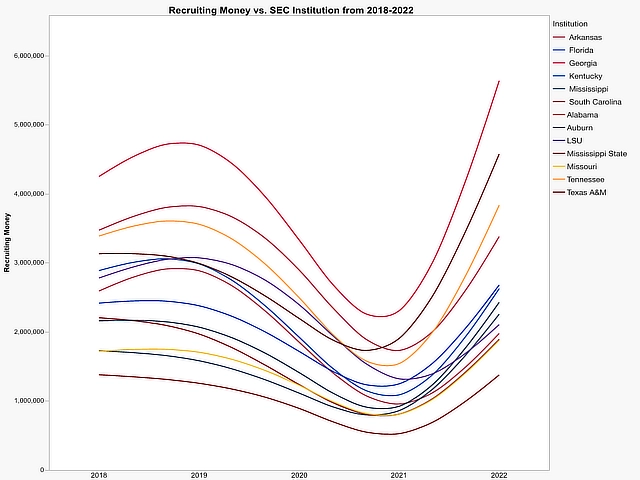
Top 3 institutions in 2018: Georgia, Alabama, Tennessee
Bottom 3 institutions in 2018: Mississippi State, Missouri, Mississippi
Top 3 institutions in 2022: Georgia, Alabama, Tennessee
Bottom 3 institutions in 2022: Mississippi State, Missouri, South Carolina
Net Results
After looking at multiple revenue and expense patterns, we can calculate the net result of each SEC team from 2018-2022. From the graph below we can conclude that…
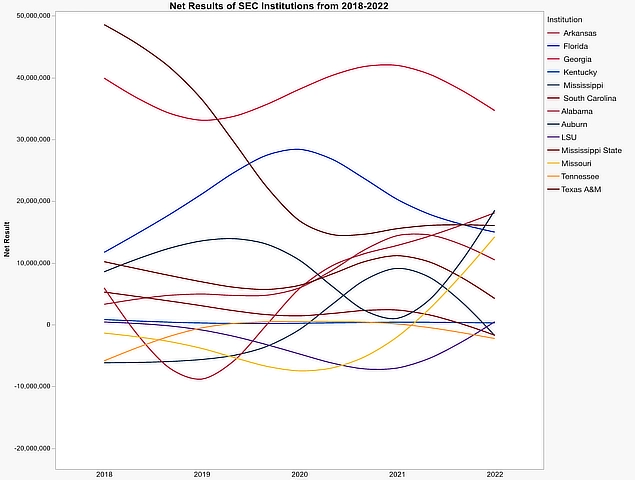
Top 3 institutions in 2018: Texas A&M, Georgia, Florida
Bottom 3 institutions in 2018: Mississippi, Tennessee, Missouri
Top 3 institutions in 2022: Georgia, Auburn, Alabama
Bottom 3 institutions in 2022: Tennessee, Mississippi, South Carolina
Conclusion
The financial performance trends of SEC athletics reflect an everchanging landscaped that is shaped by multiple revenue and expense patterns as well as external factors such as the COVID-19 pandemic. As SEC athletics continue to evolve, data-driven insights and revolutionary approaches will be important for driving success in the future.
Author

Grace Colyar