"Strip Sack" by Brook-Ward is licensed under CC BY-NC 2.0.
Impact% is a stat that measures the percentage of times a player is in position to make a play on the ball. This is an upgrade from just looking at raw tackles because a play on the ball is more valuable than a tackle. Impact% gives you a broader scope of how much range and versatility a player has and their impact in every phase of the game. It's a statistic that measures how valuable a player is while he's on the field. The purpose of the stat is to reward defenders who are on time and in position to make a play on the football. The fact that you didn't make the play is likely due to many reasons.
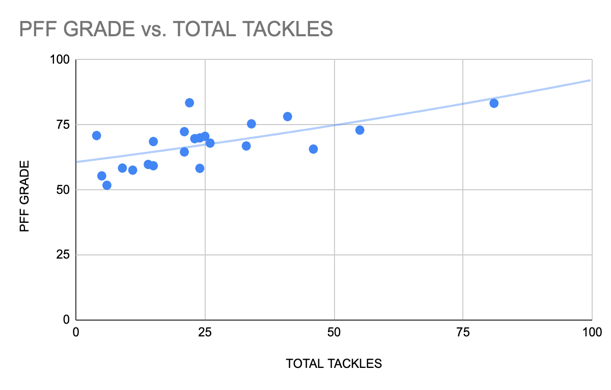
Impact% doesn't always include half tackles or half sacks because once the ball carrier is in the process of being brought to the ground, the play on the ball has already been made. Defenders who come in late and wrap up as the ball carrier is in the process of falling to the ground wouldn't count towards Impact%. It's the difference in verbiage between a "tackle" and "play on the ball." Tackle statistics can be very misleading, especially when a player has a high number of assisted tackles. Often, stats credit players who come in late, which is incredibly unfair to the defender who was on time and in the right spot, only to be rewarded with 50% of that tackle. It hurts the defender who brought the ball carrier down to the ground and unfairly rewarded a player who wasn't involved with the play in any way.
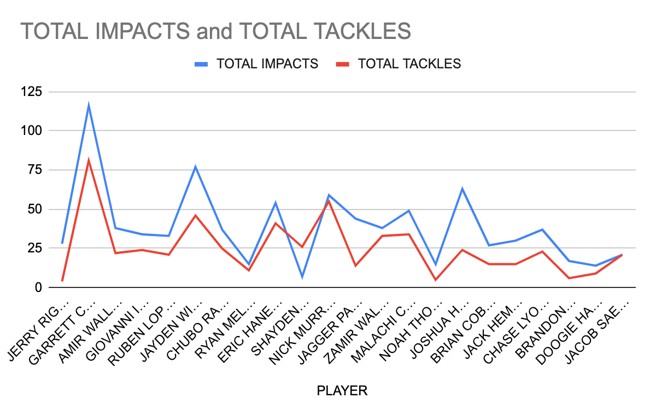
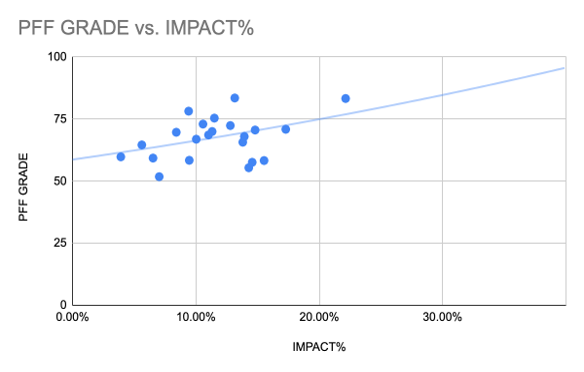
The chart above is data collected from the University of San Diego's Football team in the 2023 season. Total impacts are in blue, and total tackles are in red for every player who played at least 100 snaps. This chart shows that tackles are directly correlated to plays on the ball, but there are better ways to measure his full impact. This is because there are other things a player can do besides tackling somebody that can impact the game. Impact% gives credit to players in those hidden margins of the game that don't necessarily show up in the box score.
A perfect example is Jerry Riggins, the first player listed on the chart. He was only credited with four tackles on the season but accounted for 28 plays on the ball. If you had gone off the box score, you would've thought this player had zero impact on the game. If you looked at Impact%, you would see that this player would've benefited from seeing more opportunities on the field. He had 28 plays on the ball in just 162 snaps, which gave him an Impact% of 17.28%, the second highest on the team. This disproves what some people think: a tackle is the only thing that constitutes a play on the ball. The difference is in the number of plays on the ball every player has and the number of tackles they have. As I stated earlier, the purpose of measuring plays on the ball instead of tackles is to understand better what plays a player is making to differentiate himself on the field.
Another example that perfectly highlights the difference between tackles and plays on the ball is Shayden Molina, who is listed in the middle of the graph. This player was credited with 14 tackles in the box score and only seven plays on the ball. When you look at his numbers, you'll see that he had ten assisted tackles and only four solo tackles. This likely means that he came in late to many opportunities and contacted the defender after the play on the ball had been made. Impact% would tell you this player was relatively unproductive on the field.
For the most part, a player who isn't consistently around the ball isn't impacting the game. While there are things you can do to impact the game away from the ball, a player's impact is only felt if he is around it. Additionally, defensive players are completing specific assignments on a play unrelated to where the ball is going; the majority of that evens out through the course of a game to the point where it's irrelevant to worry about. Impact% is not just a hustle statistic, either. Many players can hustle to the ball and still not be in the correct position. Elite football players always find themselves in the correct position because they are instinctive players who can read the play and execute their assignments at a high level. This stat was created to measure players like San Francisco 49ers LB Fred Warner, who dominate every phase of the game and have range from sideline to sideline. There's also an element of athleticism involved in producing a high Impact% because you have to cover a lot of space and frequently change alignments to make plays on the ball in the run and pass game.
People argue that the field safety might be at a disadvantage because he's completely out of the run fit. On any given run play, the ball is never intended to get to the field safety. At most, 3% of your runs go for 30+ yards, 5% go for 20+, and 17% go for 10+ yards. Most of the time the ball is run, it's for small gains where the offense gains 4 to 5 yards at a time. If the defensive line and linebackers do their job, the ball should never get to the safety anyway. If the ball gets past the linebackers, there are usually problems for the defense. Yes, the field safety is at a slight disadvantage in running situations. Due to the basic nature of football, the field safety isn't designed to be making plays in these situations unless you choose to get creative with where you align him pre-snap. Some may also think a CB might be disadvantaged because of how far from the ball they are when it's snapped. With the increase of teams running the ball on the edge and the emphasis on perimeter blocking, the time to get involved in the run game has never been more critical for a CB. Even when a CB isn't being targeted, the ball often gets to the second and third level of a defense. How much awareness and range does that player show to get in position to be around the ball? When he is being targeted, how well is he putting himself in a position to significantly impact pass plays and cause incompletions? The CB can put himself in a good enough position to impact pass plays even if he never touches the ball. Instances like this are why Impact% is the best stat for measuring versatility. Versatility means that a player can involve himself in the game even when he isn't contributing to one of his areas of strength.
Special teams are an underexplored avenue of the football statistics world. Impact% is the perfect stat for a special teams coach to evaluate his position group. This would be a new-age way to assess all other players in a kickoff or punt that don't include the kicker, punter, long snapper, or return-man. Finding a way to evaluate most players on the field in these situations would be a great way to give your special teams unit an edge every week. Measuring how consistently somebody can win those matchups would be important in determining who should be on the field. Even if you're an Offensive Coordinator, this stat would be vital because it tells you who you should avoid on the field and who to expect when you run plays in certain areas. On successful pass plays, there are fewer defenders in position to make plays on the ball than in any other situation in football. If a QB throws an accurate pass, there's a chance that not a single defender is in position to make a play on the ball. The completion was probably the result of the offensive line holding up and not allowing anybody to get close to the QB. This allowed the QB a clean pocket to deliver an accurate pass, which the receiver caught because he ran a precise route and created separation from the defender. It's probable that no defenders were in position because the offense executed the play call at a high level. This shows how Impact% can also be an offensive and special teams evaluation metric despite being created for defense.
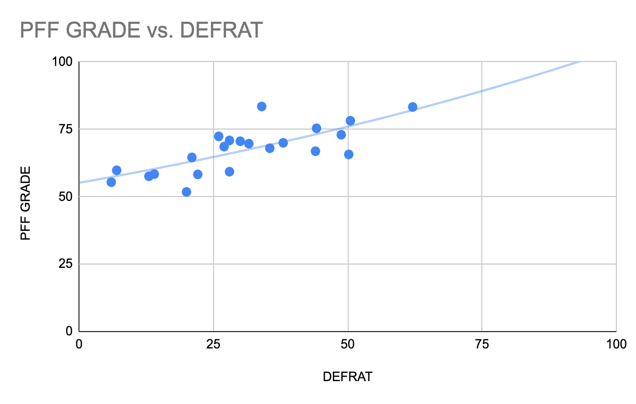
A statistic that mirrors Impact% is LOAF%. A LOAF is any time you get yourself in position to make a play on the ball and fail to do so. Impact% divided by LOAF% gives you your Defensive Rating (DEFRAT), which calculates how often you put yourself in a position to make a play on the ball and successfully do so. It also measures the percentage of times you get yourself in perfect position to impact the game. It's almost like the percentage of times you get yourself in perfect position to make a play. Think about it as how efficient you are with the chances you've been given. It indicates that you could produce at that same level and make an impact if given more chances. It gives more credence to the result of the play more than Impact% does. It heavily penalizes whiffs, which often result in big plays for the offense. Defensive Rating (DEFRAT) is attractive because you can mess around with how you want to calculate it. For example, a player who records a pick-six on a given play will only be rewarded with the play on the ball and not the fact that he returned it for a touchdown. Clearly, that should be worth more than just any other regular play on the ball. That should generate some positive boost for his DEFRAT. The question becomes, how much do you value it? Do you increase his rating by 1 point? By .75? As of now, there's yet to be a definitive way to decide that.
Another example is a defensive lineman who gets a sack and then recovers the ball to give his team possession after the QB fumbled. How much do you increase his rating? Do you give more weight to plays on the ball made in high-leverage situations? It's a healthy debate that would lead to lots of interesting discussions. One idea I was thinking about was combining EPA with Impact% or DEFRAT to see how impactful your plays on the ball are to the game. How much EPA do the plays on the ball you make generate? It would be an exciting way to see which players make the most big-time plays every game. When discussing it with a coach on our staff, he said that DEFRAT did an excellent job of indirectly ranking the best players on our defense. Defensive Rating (DEFRAT) gives you the best of both worlds and is an essential metric for every defensive position.
The practical usage of Impact% comes when any coach or talent evaluator is looking at their defense. How often is X player around the ball, and how frequently is he getting opportunities to make plays? A more efficient player at the same position (a player with a higher DEFRAT) might benefit from increased snaps. Additionally, breaking down Impact% into specific areas of the game, such as blitzing, coverage, run defense, etc., might help a coach to better understand a player's strengths and which situations he's likely to make a play in, which will set him up for success. Positionally, a coach might see that a player has a higher Impact% when playing a different alignment or position, which might influence him to alter the usage of that player. For a talent evaluator, Impact% would be sure to find many undervalued defensive players whose talent might be less enthralling to the team he's playing on. No college or pro football team uses plays on the ball to measure defensive performance. You would be the first to have a streamlined way to capture defensive performance and, in turn, would find valuable players at every position. If you're an Offensive Coordinator and call a specific running concept, wouldn't you love to know which defenders will most likely impact that play before it even happens? Having that knowledge would be another element of game planning for an OC. Another practical usage of Impact% for offenses is knowing when a CB has a high Impact% on specific routes. This may make the Offensive Coordinator second guess certain concepts and force you into running more concepts where their corners are less impactful.
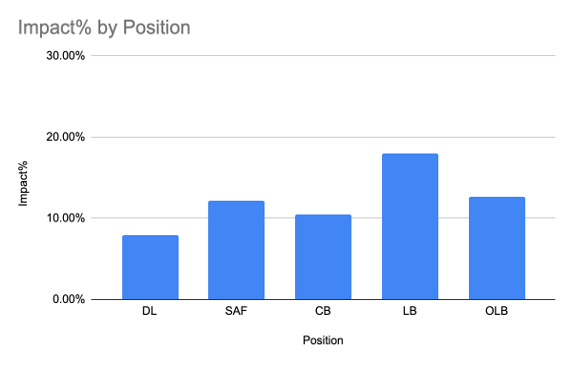
Graphs
 About the Author
My name is Adam Carter, I currently work as the Director of Player Personnel for the University of San Diego. I was a May 2022 graduate of Syracuse University where I studied Sports Management.